Product Overview gives you a complete summary of how your app or website is performing.Documentation Index
Fetch the complete documentation index at: https://docs.paraminternationalltd.com/llms.txt
Use this file to discover all available pages before exploring further.
Review product health
The top view gives a quick summary of your product performance. You can check new users, active users, retention users, average session duration, and country-wise active users.This view is useful when you want a fast answer to: How is my product performing today?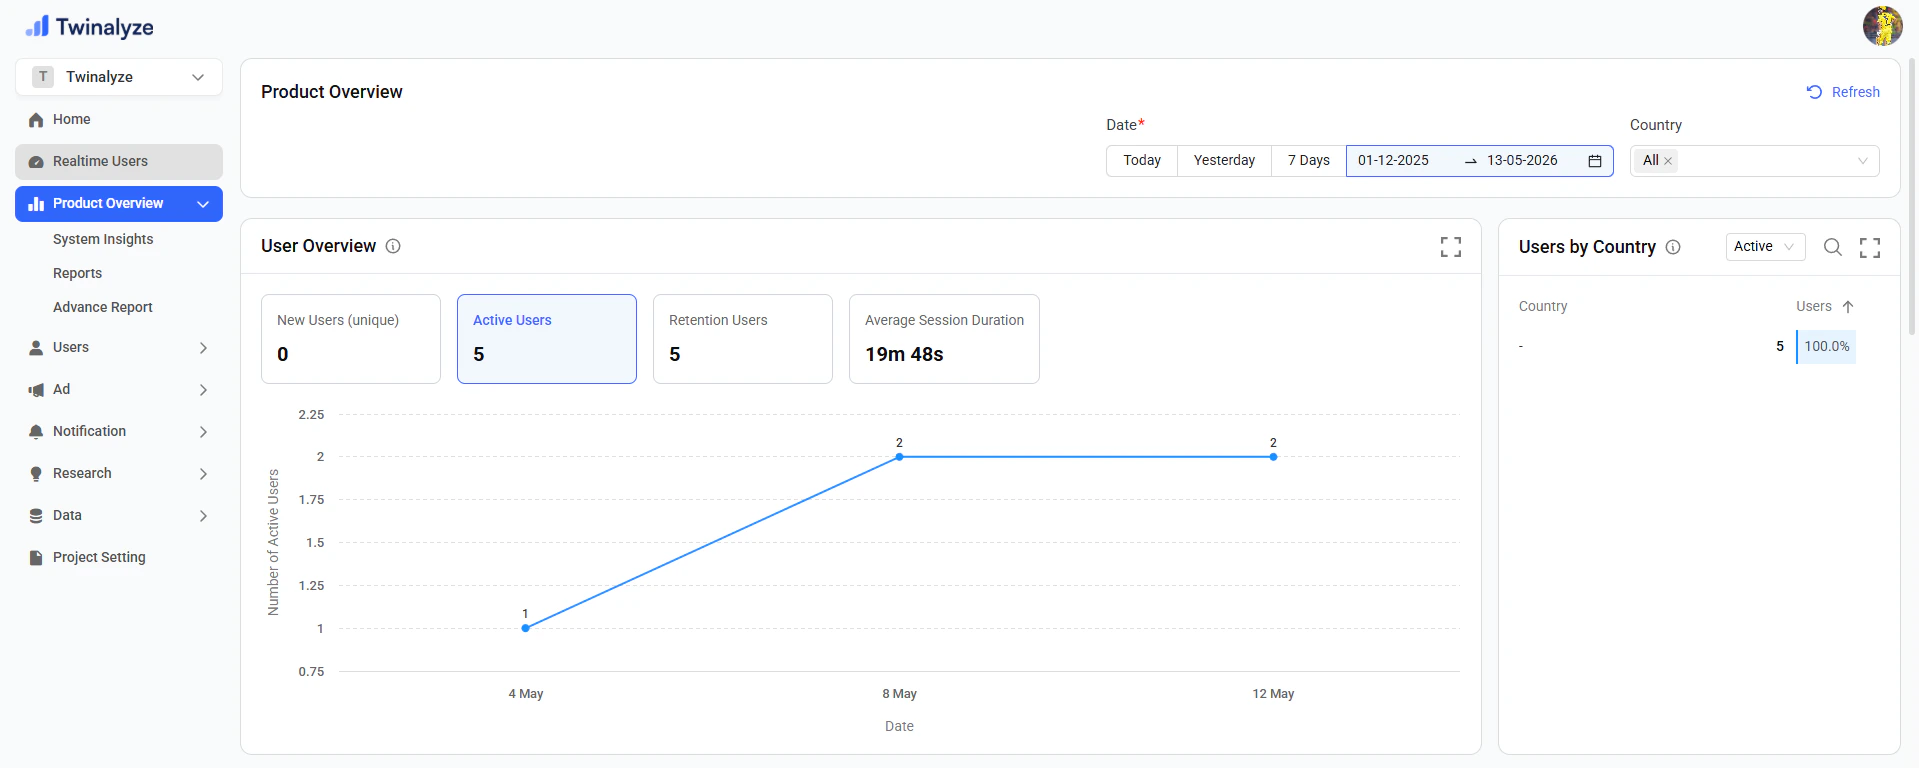
Understand acquisition and app opens
This section shows where users are coming from and how many times they opened the app.It helps you understand which traffic source brings users and whether users open the app only once or return multiple times.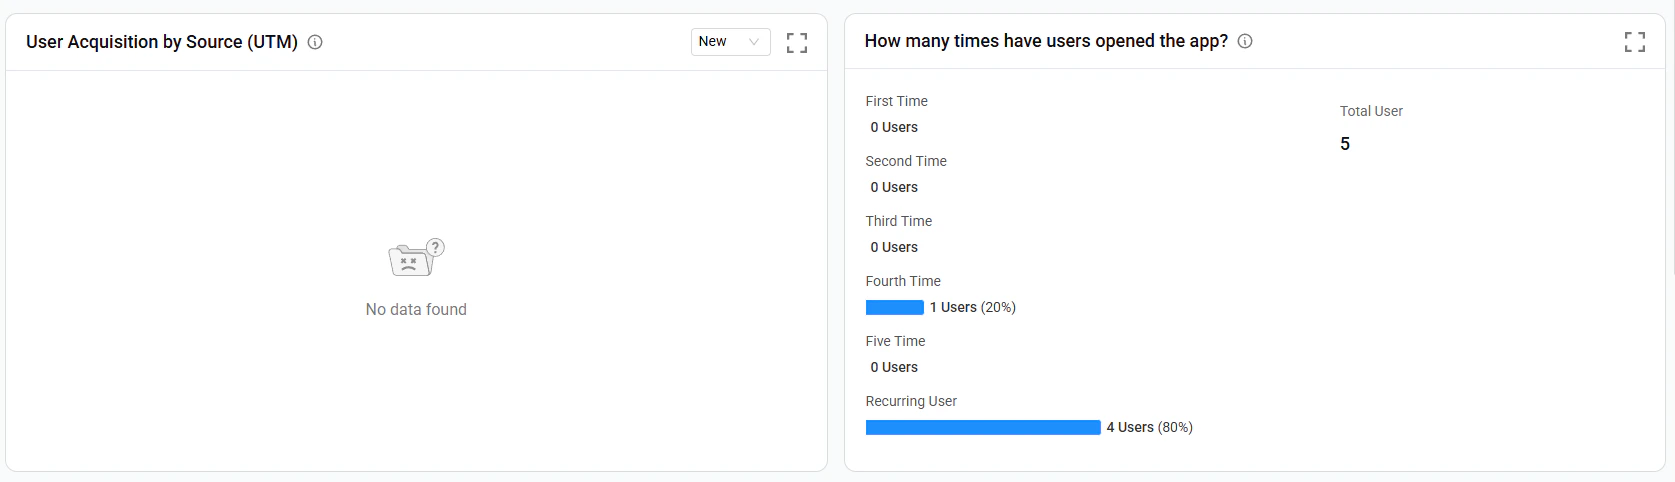
Review page depth and permissions
This section explains how many pages users view on average and how users respond to permissions.It helps you understand browsing depth and whether users are allowing or denying important app permissions.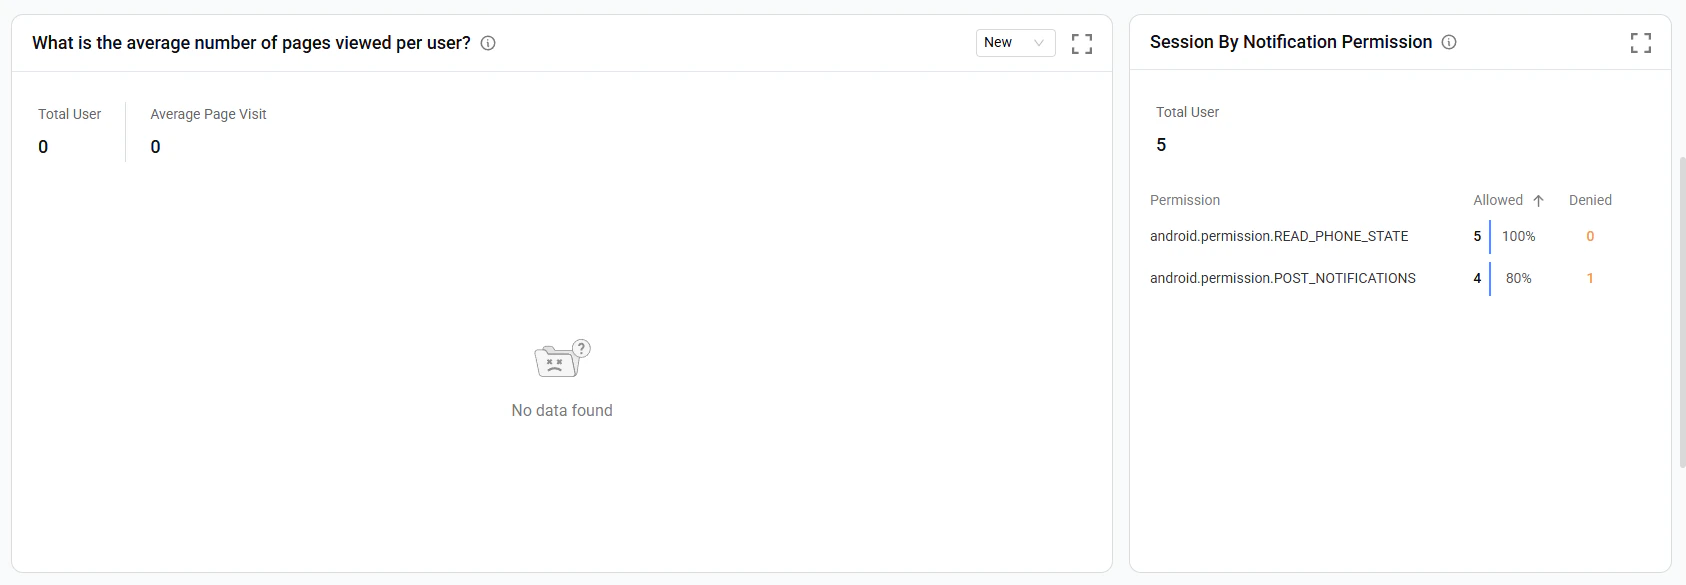
Check retention and ratings
This section shows whether users are returning after their first activity and how app ratings are distributed by country.It is useful for understanding user loyalty and country-wise product feedback.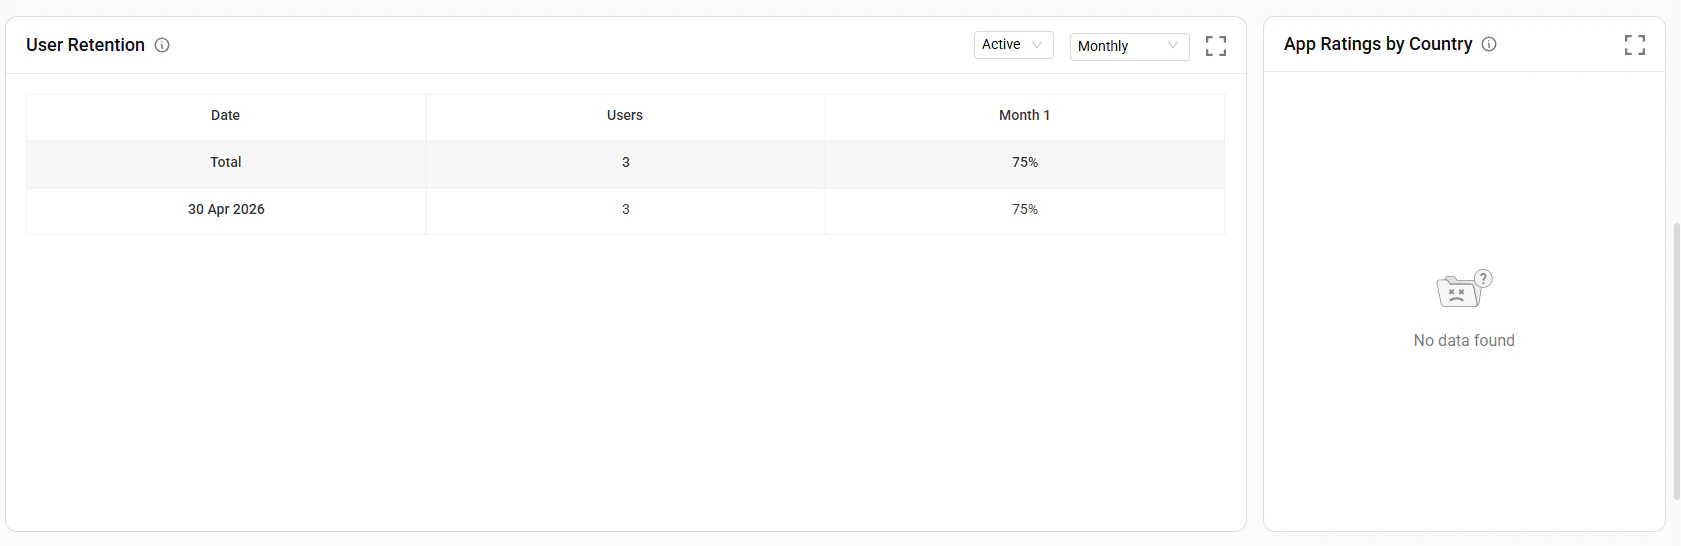

How to use Product Overview
Select date range
Choose Today, Yesterday, 7 Days, or a custom date range based on the period you want to review.
Start with the top metrics
Review new users, active users, retention users, and average session duration to understand product health.
Check traffic and engagement
Review acquisition source, open frequency, average page views, and notification permissions.
Common use cases
Understand product health
Understand product health
Use top metrics to quickly check active users, retention users, and average session duration.
Find best traffic sources
Find best traffic sources
Use User Acquisition by Source to see which platforms or campaigns bring the most users.
Measure user engagement
Measure user engagement
Use app open frequency and average pages viewed to understand how strongly users interact with the product.
Review permission problems
Review permission problems
Use Notification Permission to see where users allow or deny important app permissions.
Track version adoption
Track version adoption
Use Version Distribution to understand how many users are on old or new app versions.
Check growth quality
Check growth quality
Use App Growth to compare installs and uninstalls and understand whether your product is growing steadily.
Product Overview gives your team a simple product health summary across users, traffic, engagement, retention, versions, and growth.