

 Overview
 Analytics
 SDKs
SDKs Integrations
 Changelog
- compare event trends over time
- analyze user movement between events
- apply filters and groups
- review charts and exact values together
- save a report for reuse later
Explore Advanced Report
- Segmentation
- Funnel
Segmentation
Segmentation helps you compare one or more events over time.1
Open Segmentation
Start by opening Advanced Report and staying on the Segmentation tab.This is the starting point for trend analysis. From here, you can choose an app, date range, and begin building your report.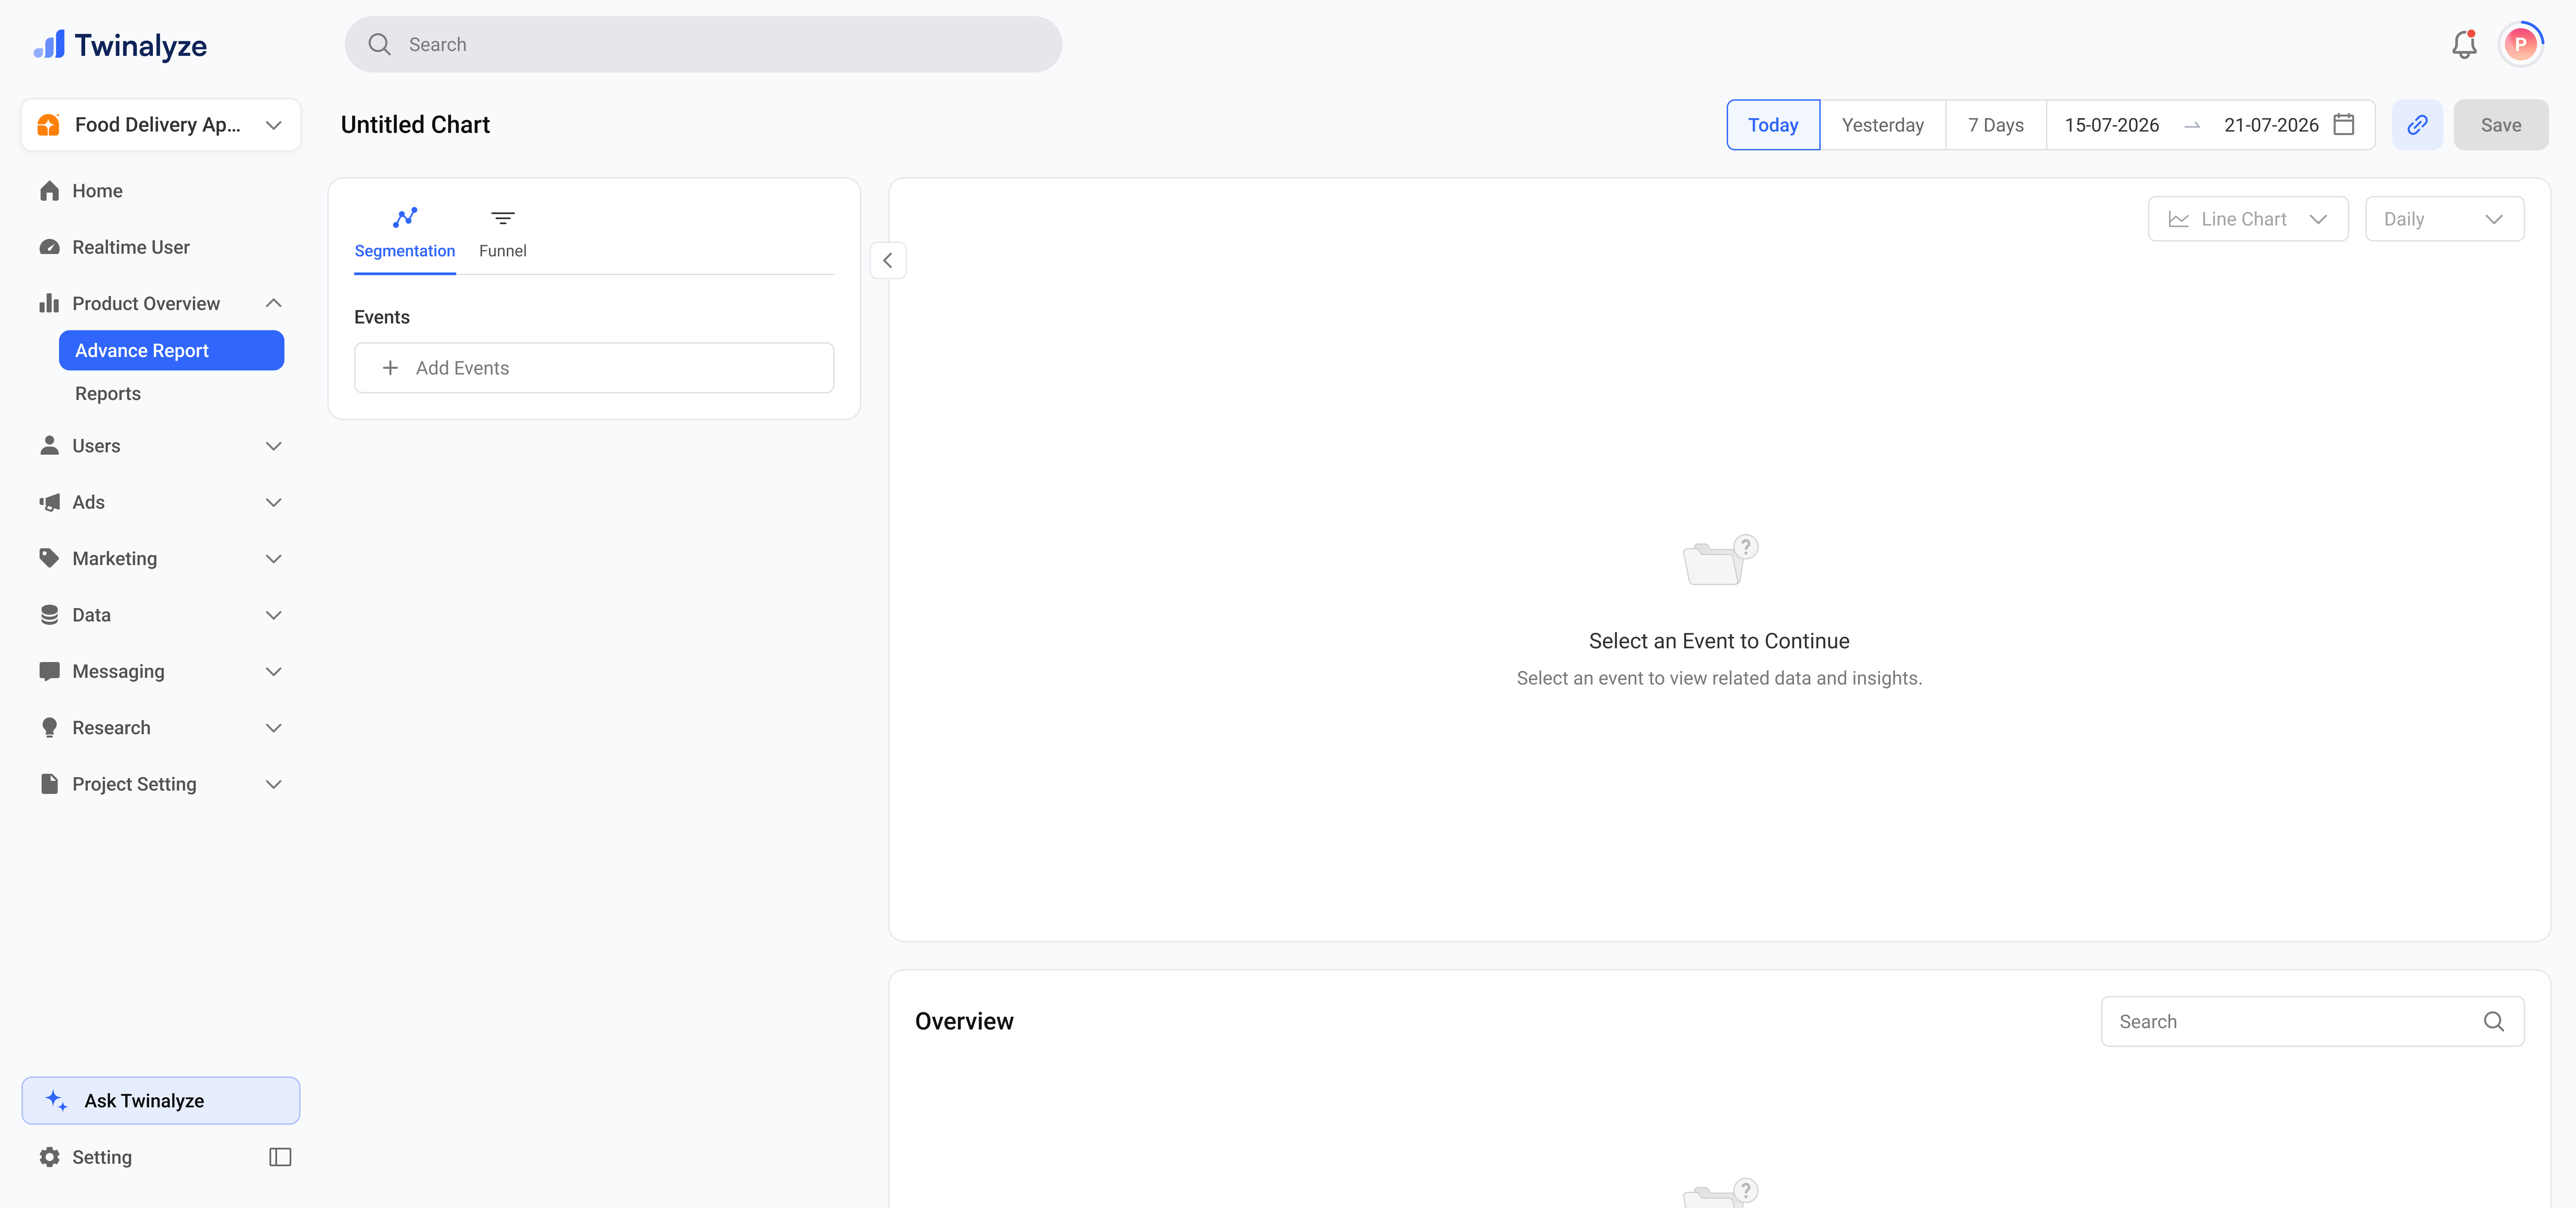
2
Add an event
Click Add Event and select the event you want to analyze.Each selected event appears as a block with a label such as A, B, or C. This helps you compare multiple events in the same report.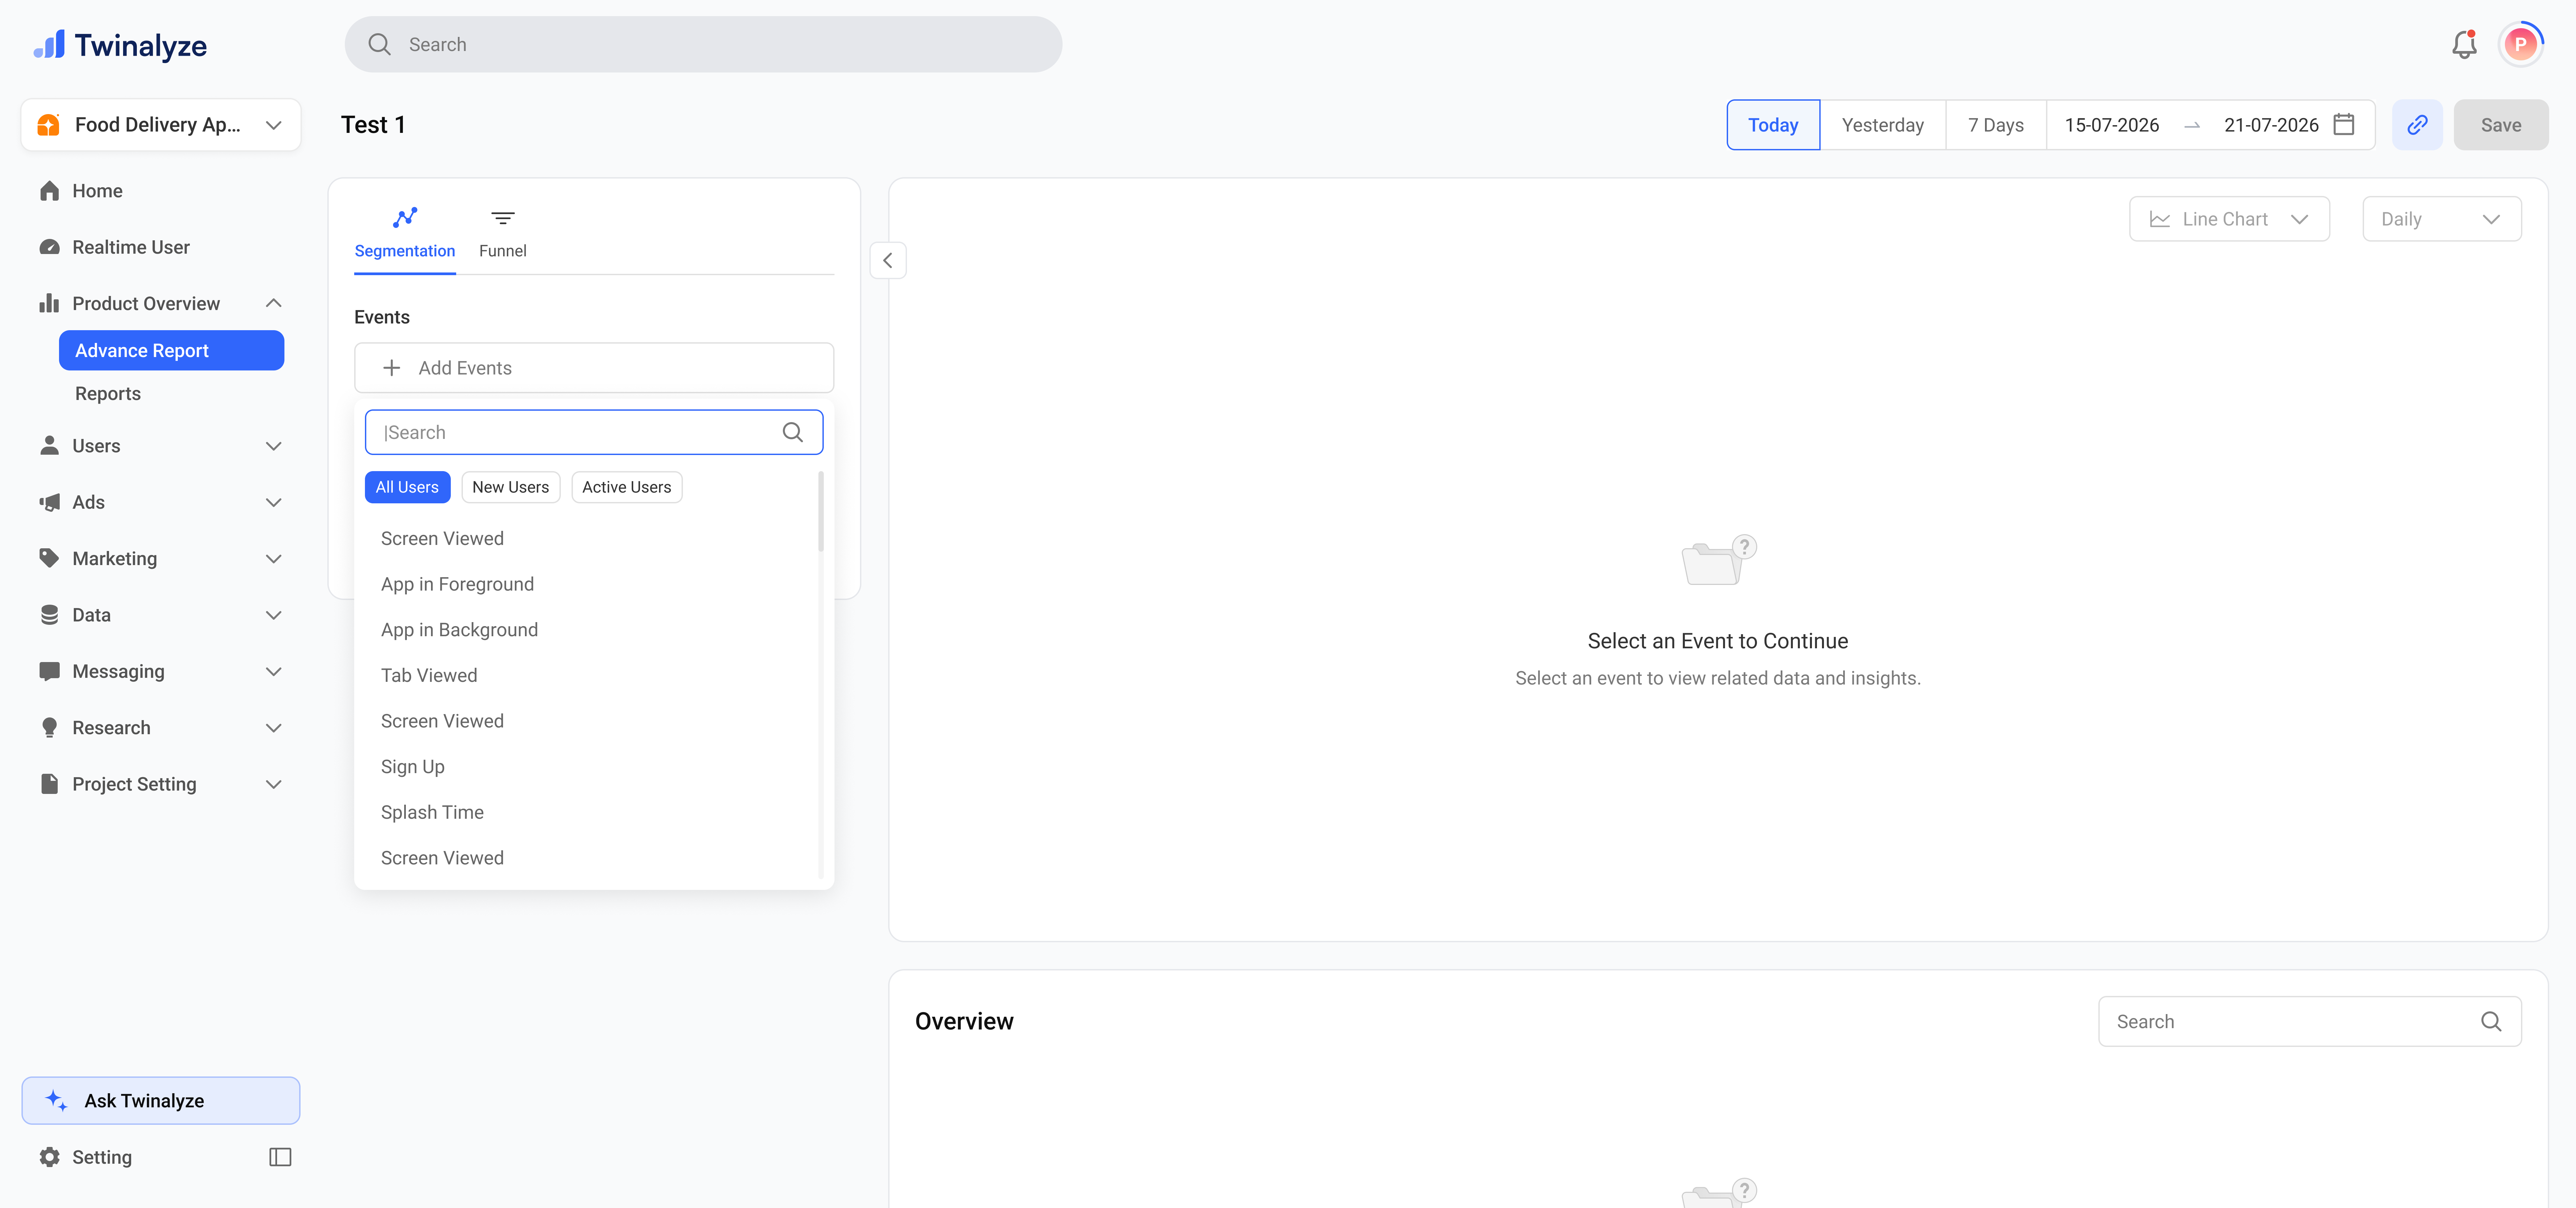
3
Use Filter by and Group by
Use Filter by to narrow the report to a specific audience or condition.Use Group by to split the event into meaningful segments such as country, city, Android OS, brand, or other properties.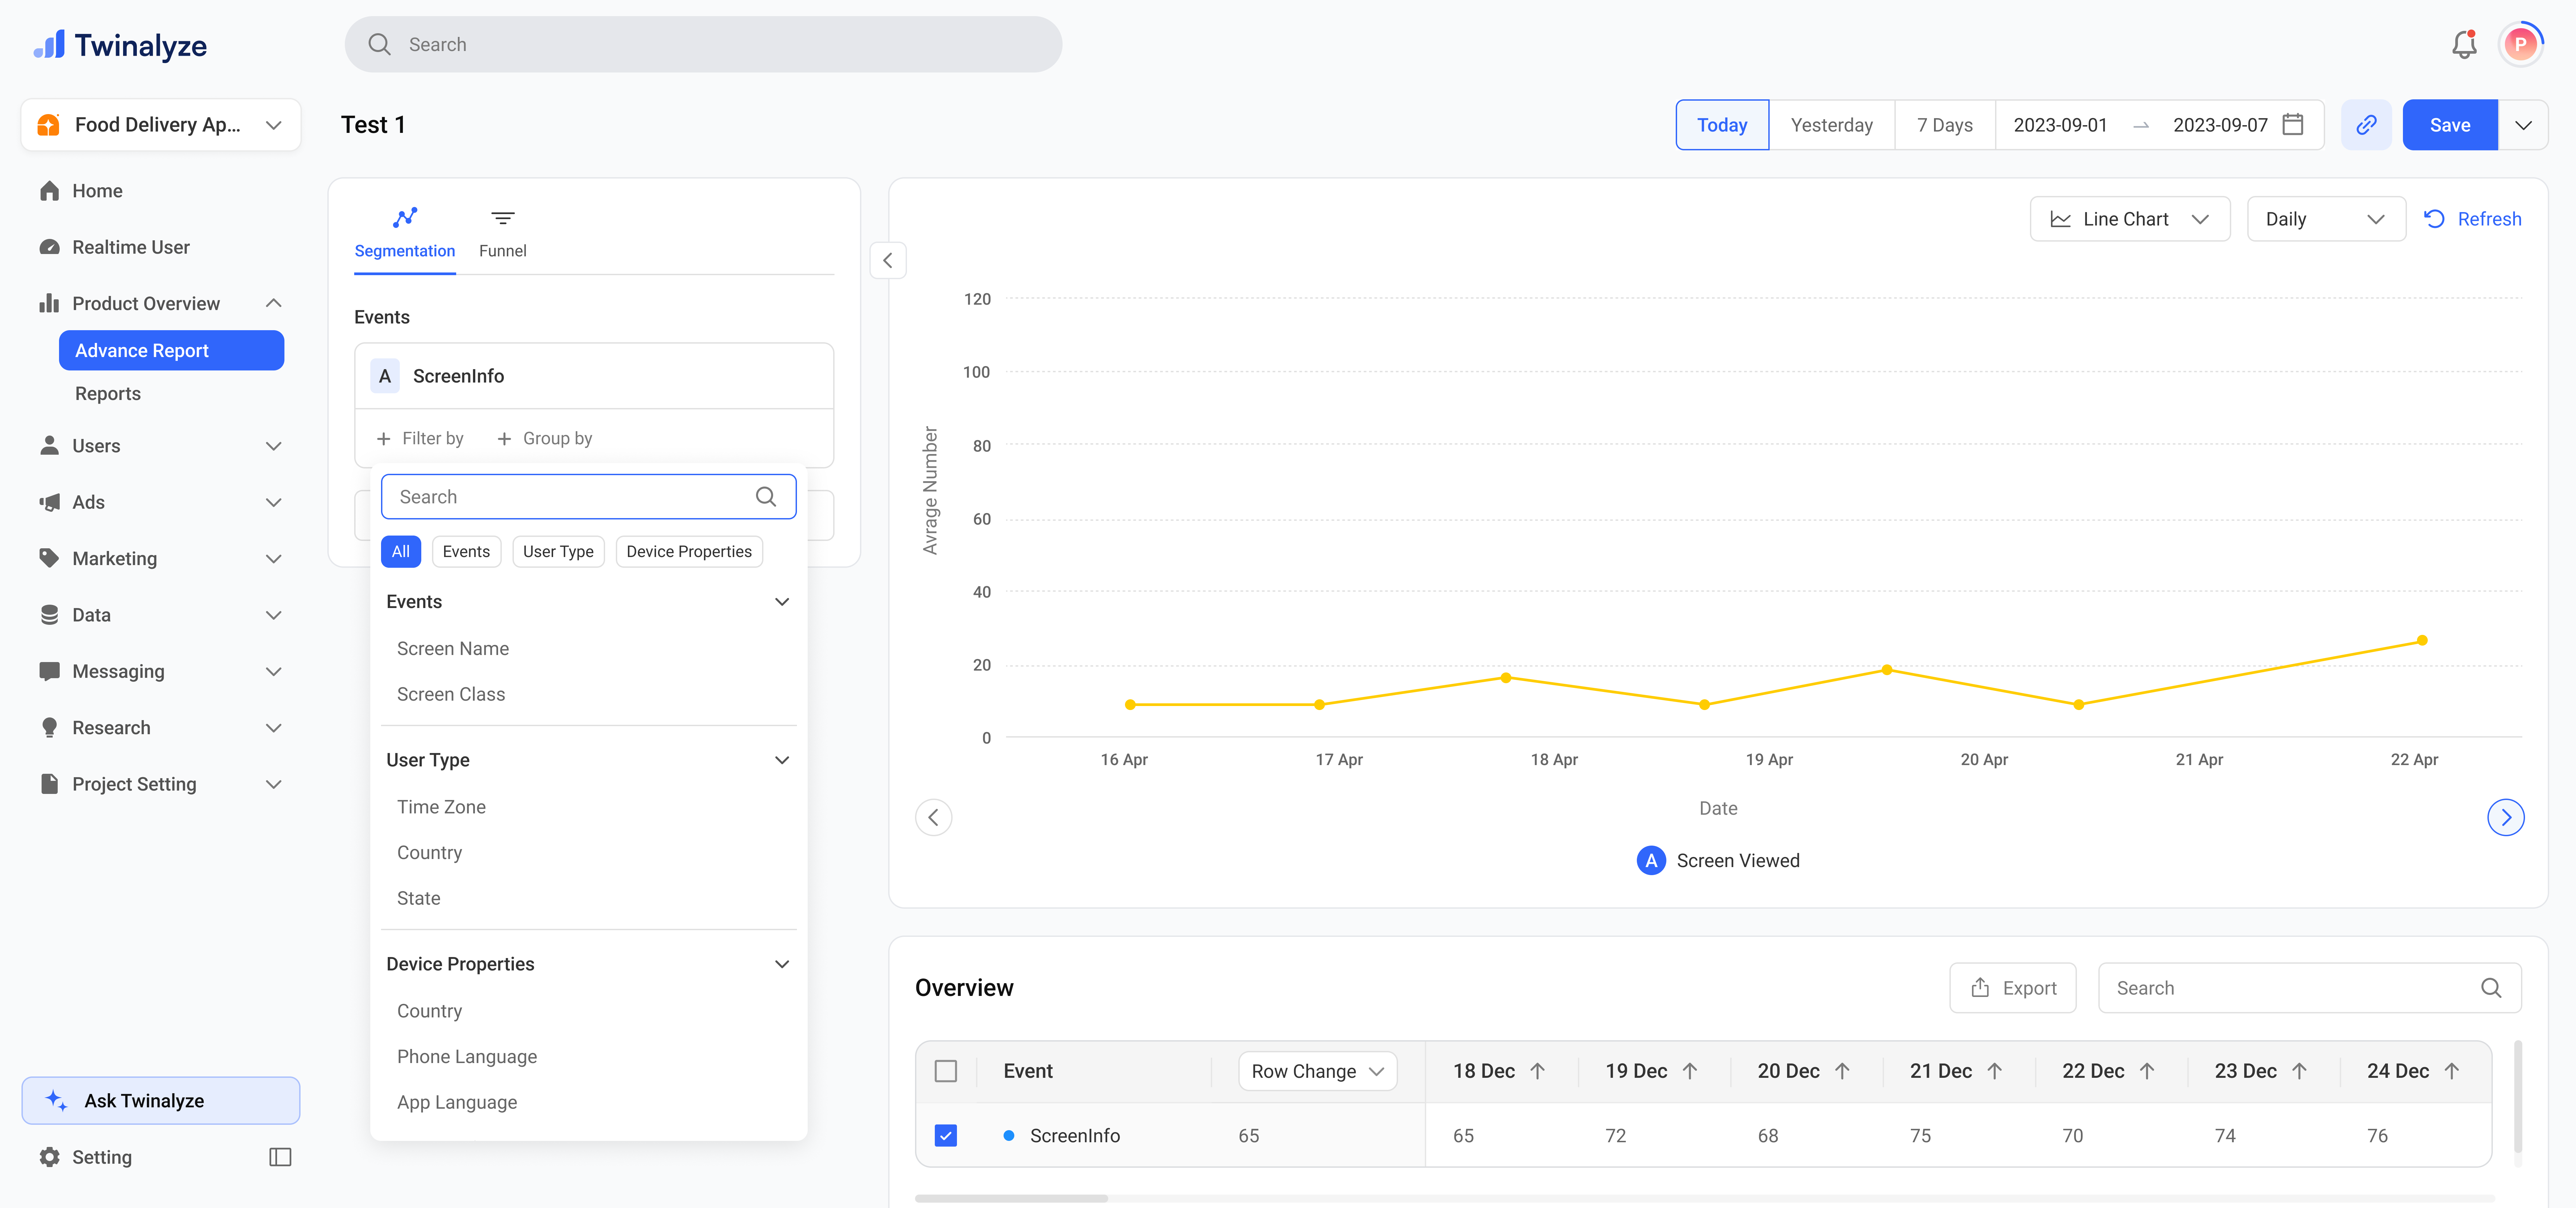
4
Choose chart type and review results
You can switch the chart type based on how you want to view the data: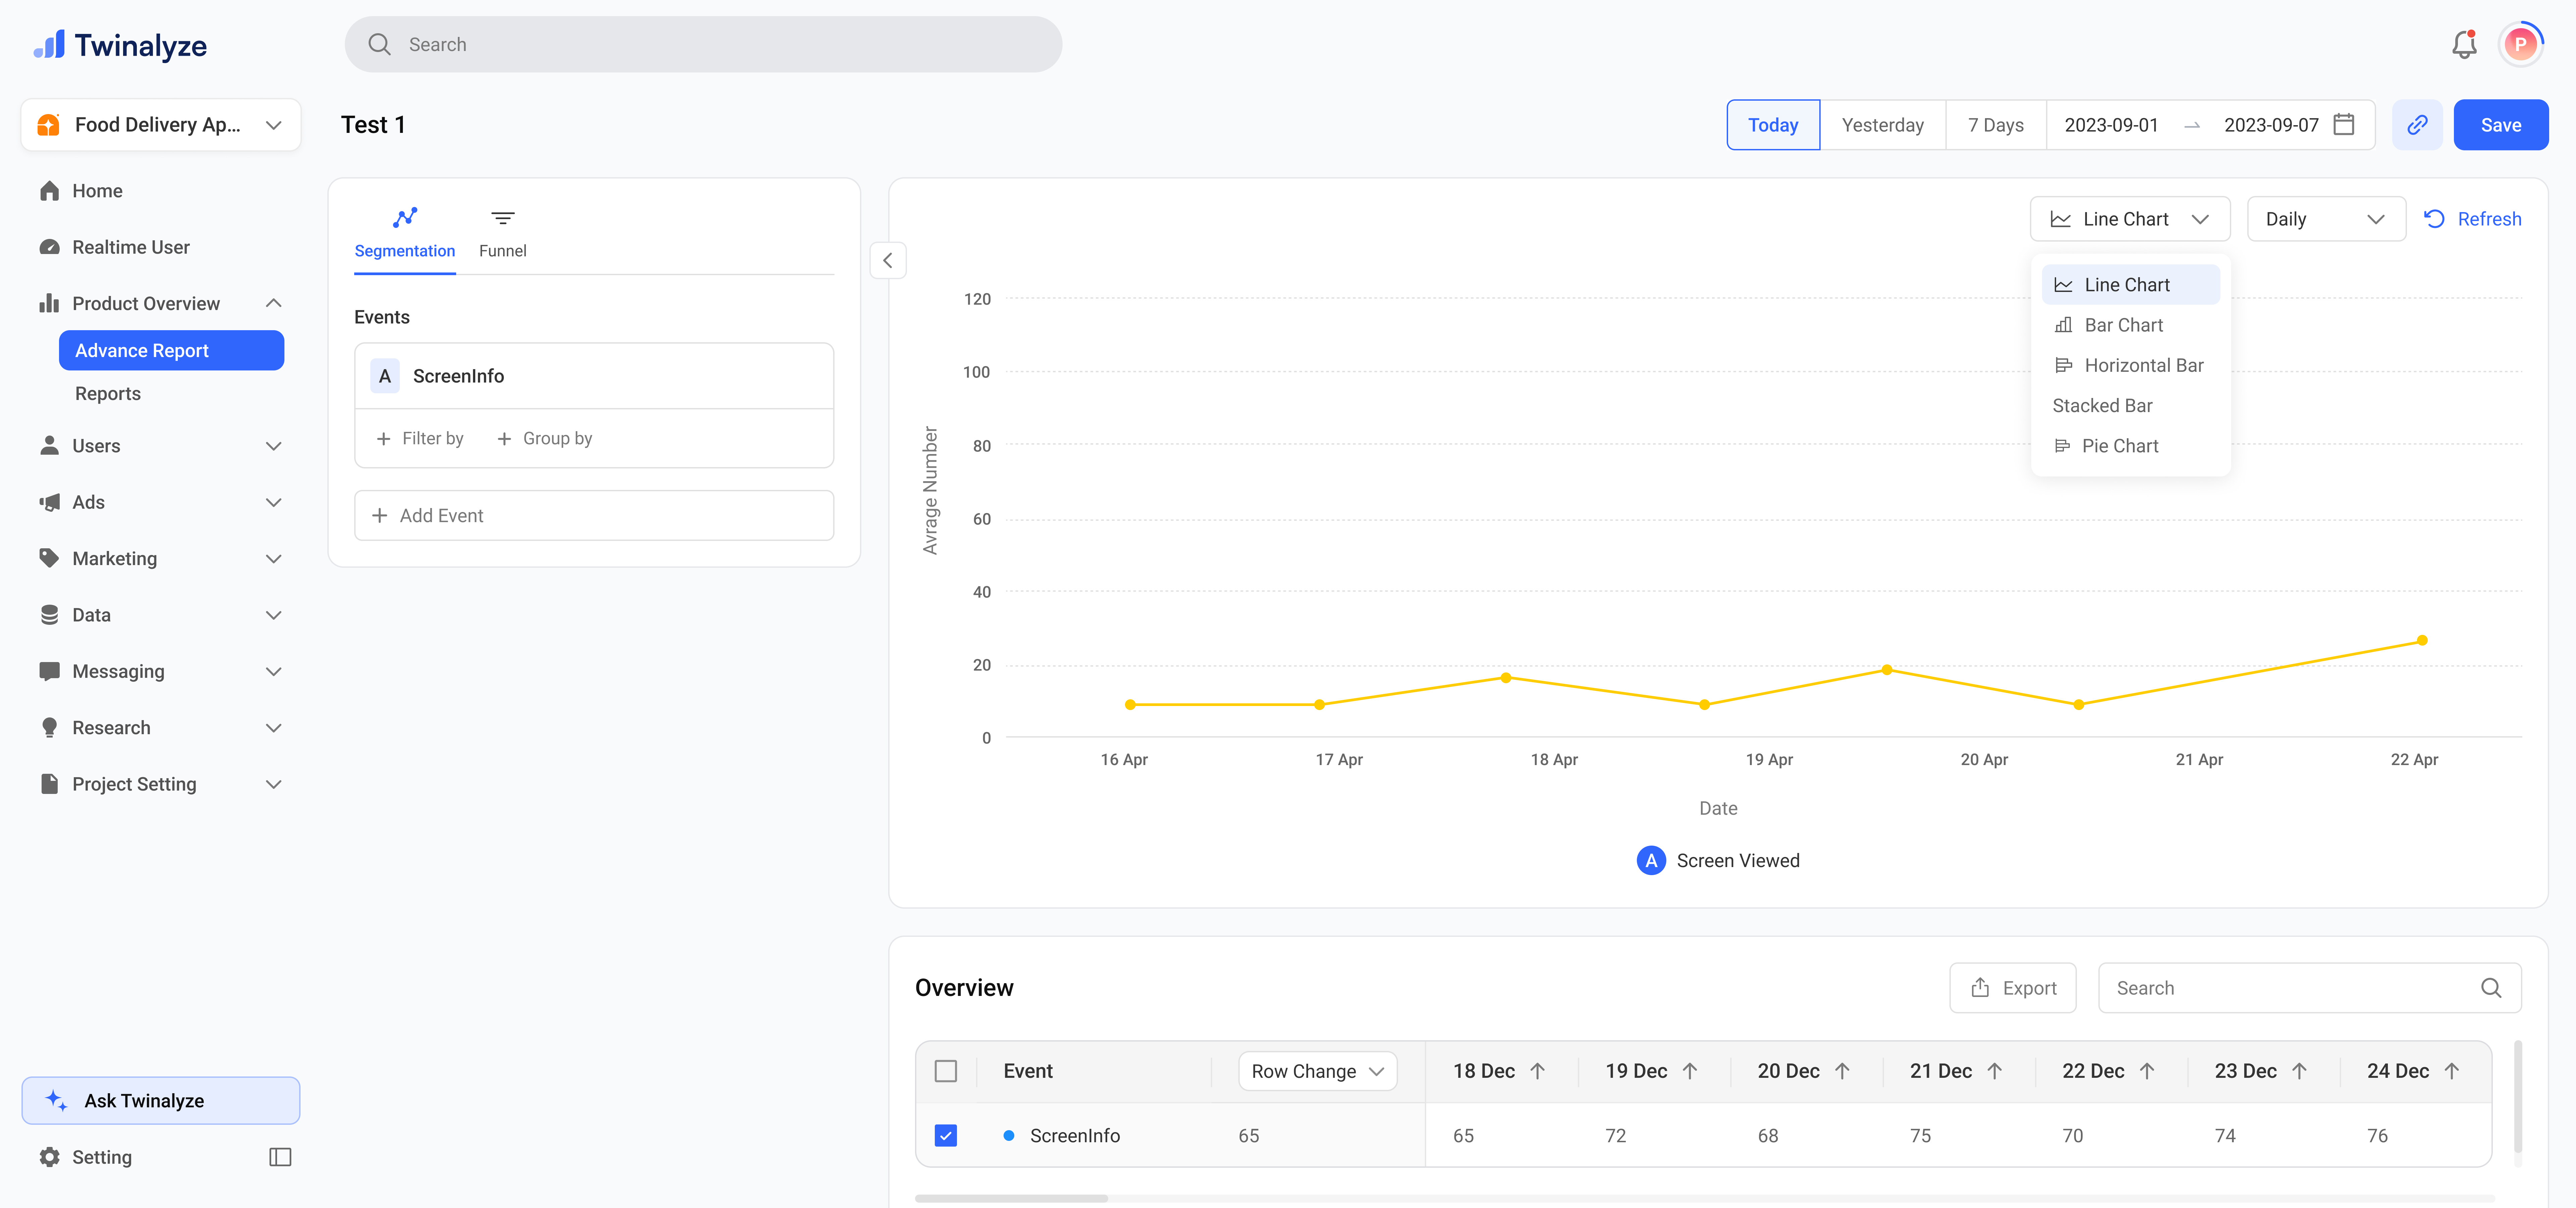
- Line Chart for trends over time
- Bar Chart for event comparison
- Stacked Bar for grouped comparison
- Pie Chart for distribution view
5
Save the report
After setting up your event selection, filters, chart type, and date range, click Save.Saving helps you keep the same report configuration so you or your team can open it from Product Overview > reports.


