Ad Report helps you review ad performance across countries, ad networks, and ad formats.Documentation Index
Fetch the complete documentation index at: https://docs.paraminternationalltd.com/llms.txt
Use this file to discover all available pages before exploring further.
Filter ad report data
Review ad performance table
What Ad Report helps you understand
Track how many ads were requested, loaded, shown, and failed.
Review ad clicks and CTR to understand how users interact with ads.
Compare ad performance by country, ad company, and ad format.
Filters
Report filters
Filters help you narrow the report to the right app, country, ad company, ad format, and time period.
Select Today, Yesterday, 7 Days, or a custom date range to review ad performance for a specific period.
Choose the app whose ad performance you want to analyze.
Select one or more countries to compare ad performance by region.
Filter by ad network or ad company, such as AdMob, Facebook, or other configured providers.
Filter by format such as native, banner, interstitial, rewarded, app open, or other supported ad types.
Use Submit to apply filters and Refresh to reload the latest available report data.
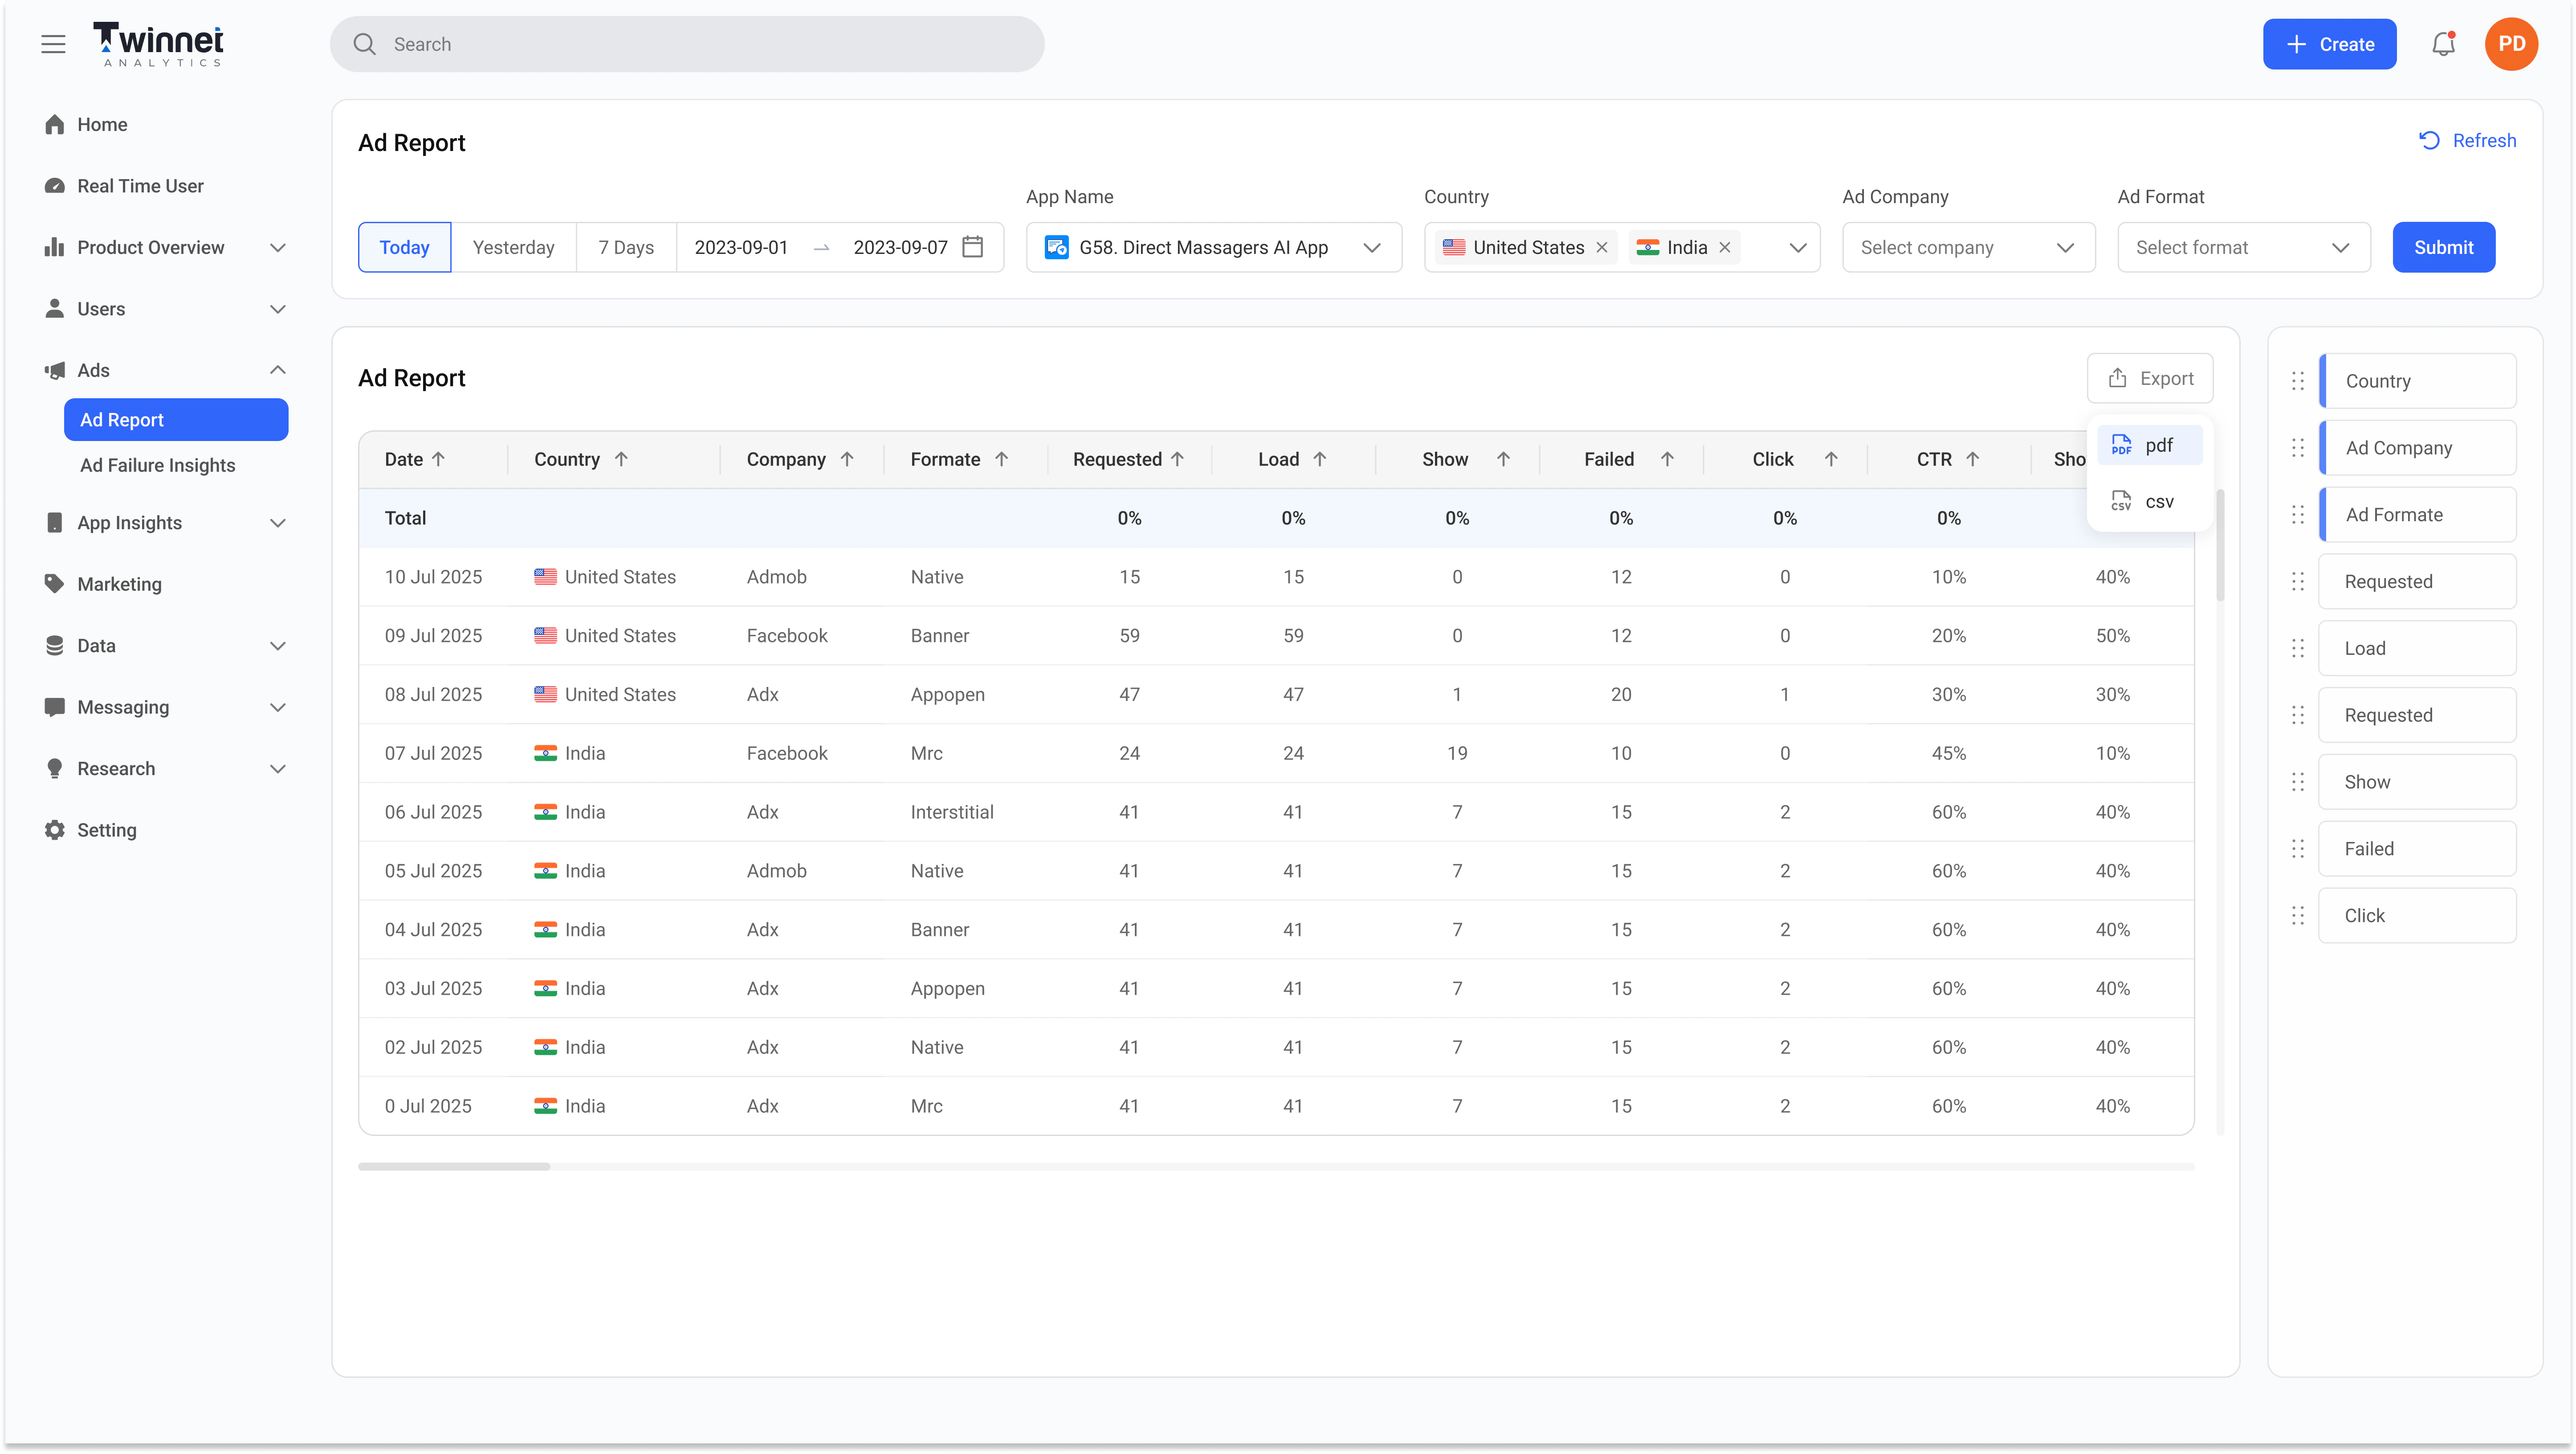
Report table
The Ad Report table gives a detailed date-wise view of ad performance. Each row represents ad activity for a selected date, country, ad company, and ad format.Metric guide
Use these fields to understand ad delivery, ad failures, and user interaction quality.
Number of ad requests sent from the app.
Number of ads successfully loaded after being requested.
Number of ads actually shown to users.
Number of ad requests or loads that failed.
Number of times users clicked on shown ads.
Click-through rate. It helps measure how many shown ads received clicks.
How to export
Prepare the report before sharing it with your team. You can choose the columns you need, keep the table focused, and export the final report as PDF or CSV.PDF is better when the report needs to be readable, presentable, and easy to send.
CSV is better when the team needs to sort, filter, compare, or calculate values manually.
Common use cases
Compare ad networks
Compare ad networks
Find ad failures
Find ad failures
Measure ad engagement
Measure ad engagement
Analyze country-wise performance
Analyze country-wise performance
Review ad format quality
Review ad format quality
Share reports with team
Share reports with team