> ## Documentation Index
> Fetch the complete documentation index at: https://docs.paraminternationalltd.com/llms.txt
> Use this file to discover all available pages before exploring further.
# Advanced Report
> Create custom Segmentation and Funnel reports with event filters, group by options, charts, tables, and saveable report configurations.
Advanced Report helps you build custom reports from your tracked events.
Use it when you want to:
* compare event trends over time
* analyze user movement between events
* apply filters and groups
* review charts and exact values together
* save a report for reuse later
***
## Explore Advanced Report
### Segmentation
Segmentation helps you compare one or more events over time.
Start by opening **Advanced Report** and staying on the **Segmentation** tab.
This is the starting point for trend analysis. From here, you can choose an app, date range, and begin building your report.
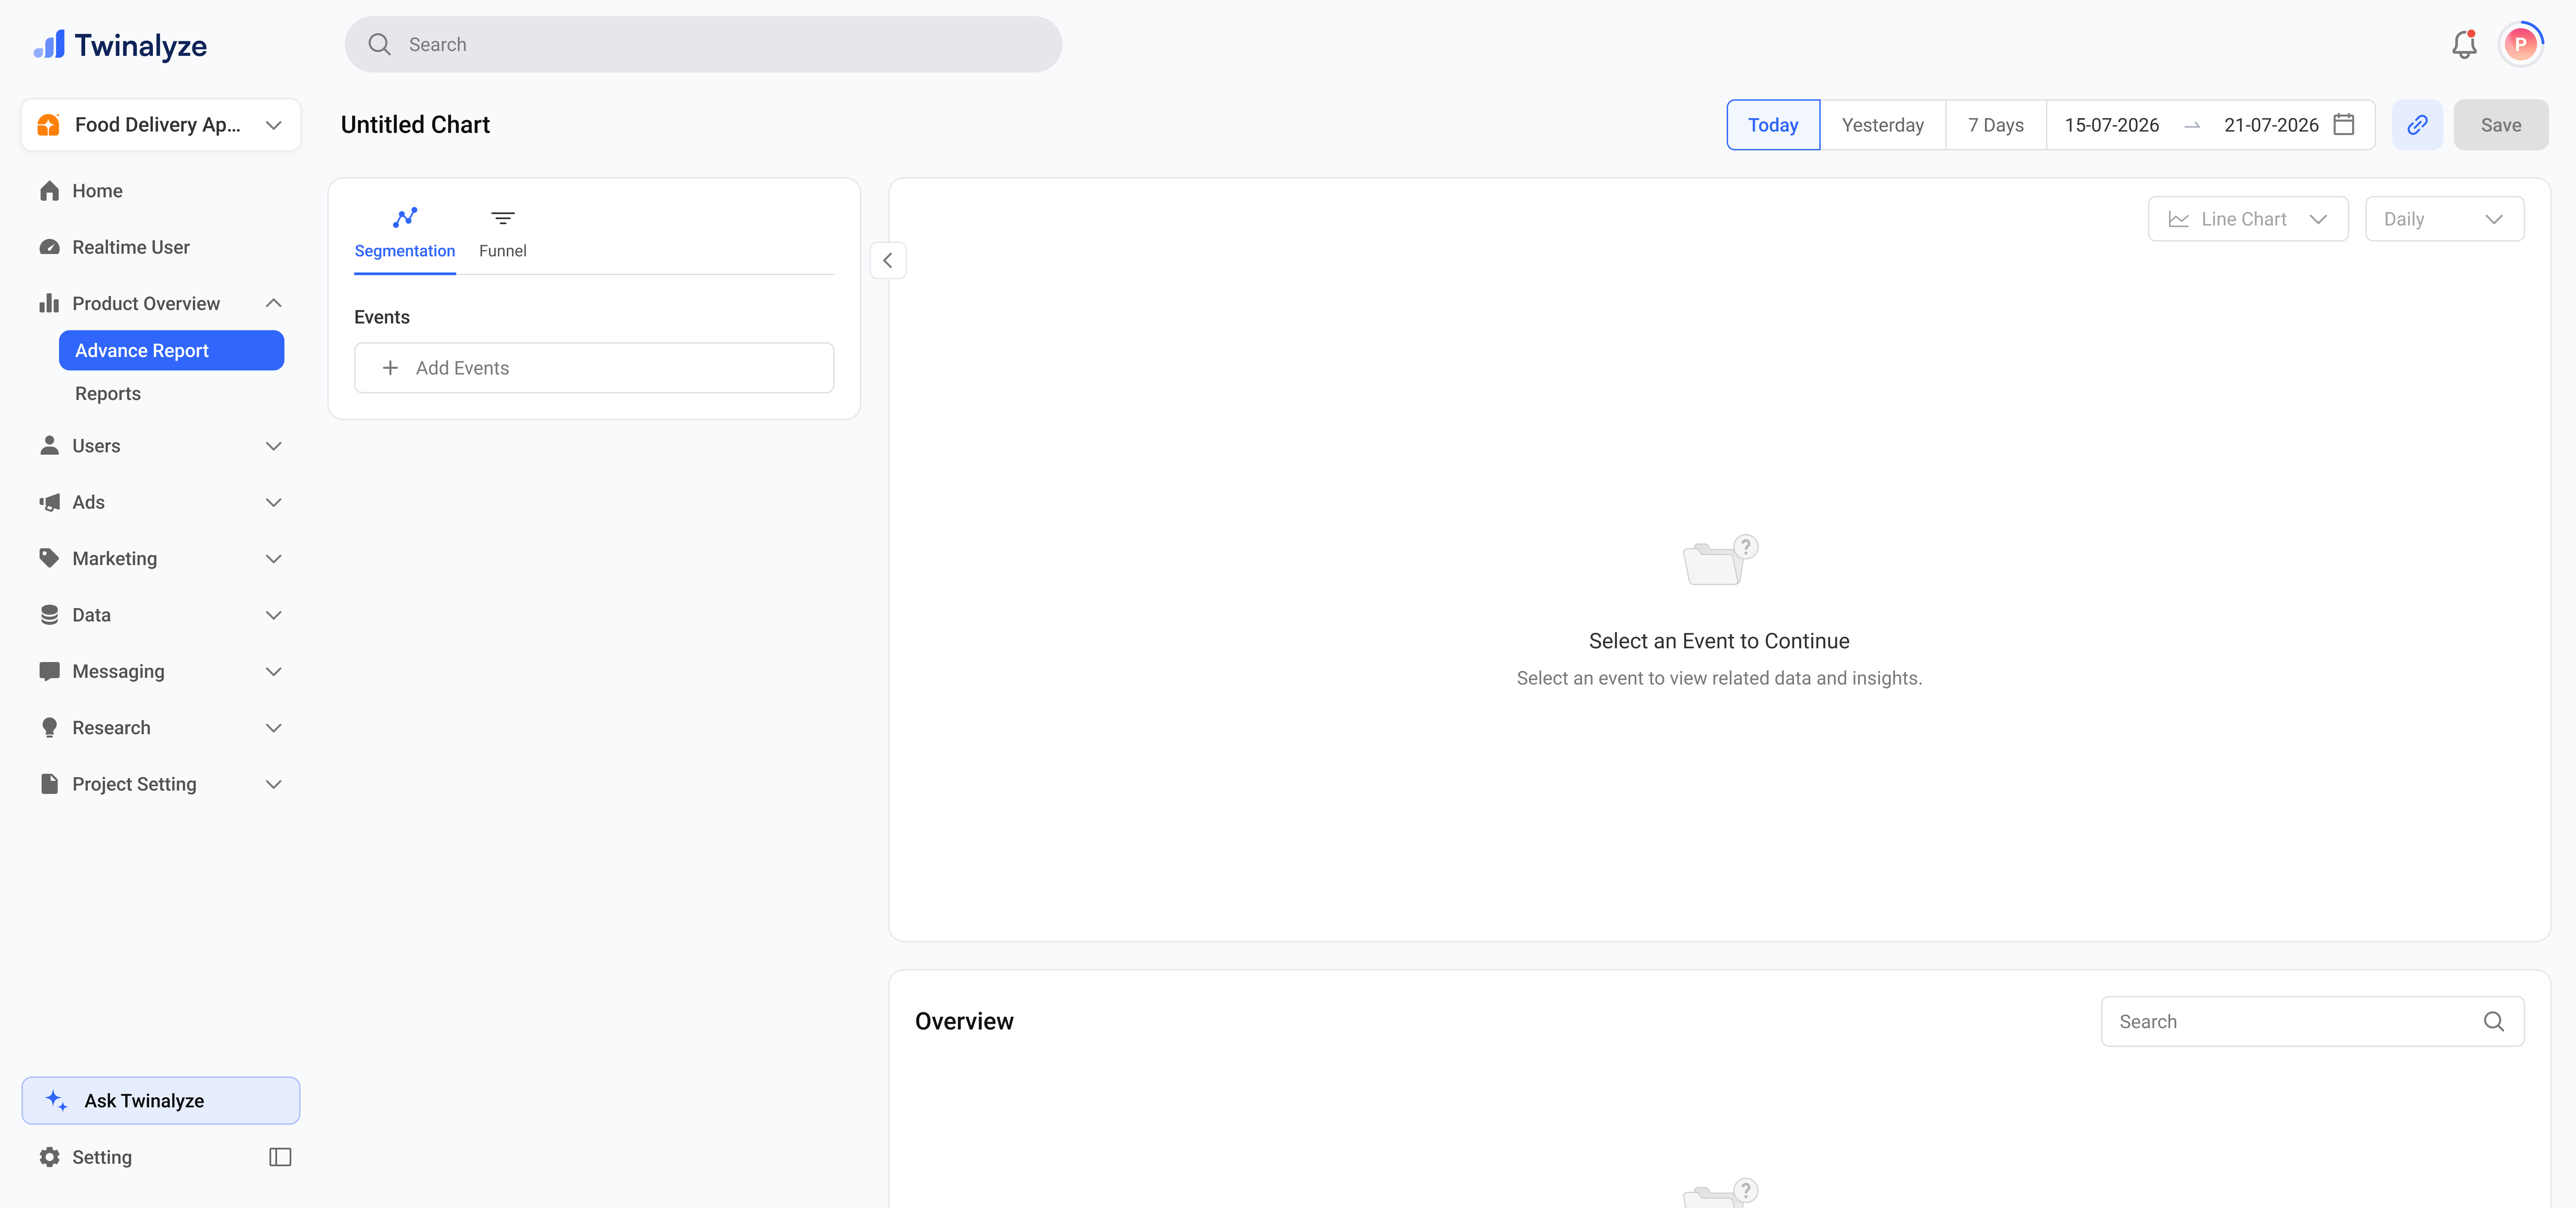 Click **Add Event** and select the event you want to analyze.
Each selected event appears as a block with a label such as **A**, **B**, or **C**. This helps you compare multiple events in the same report.
Click **Add Event** and select the event you want to analyze.
Each selected event appears as a block with a label such as **A**, **B**, or **C**. This helps you compare multiple events in the same report.
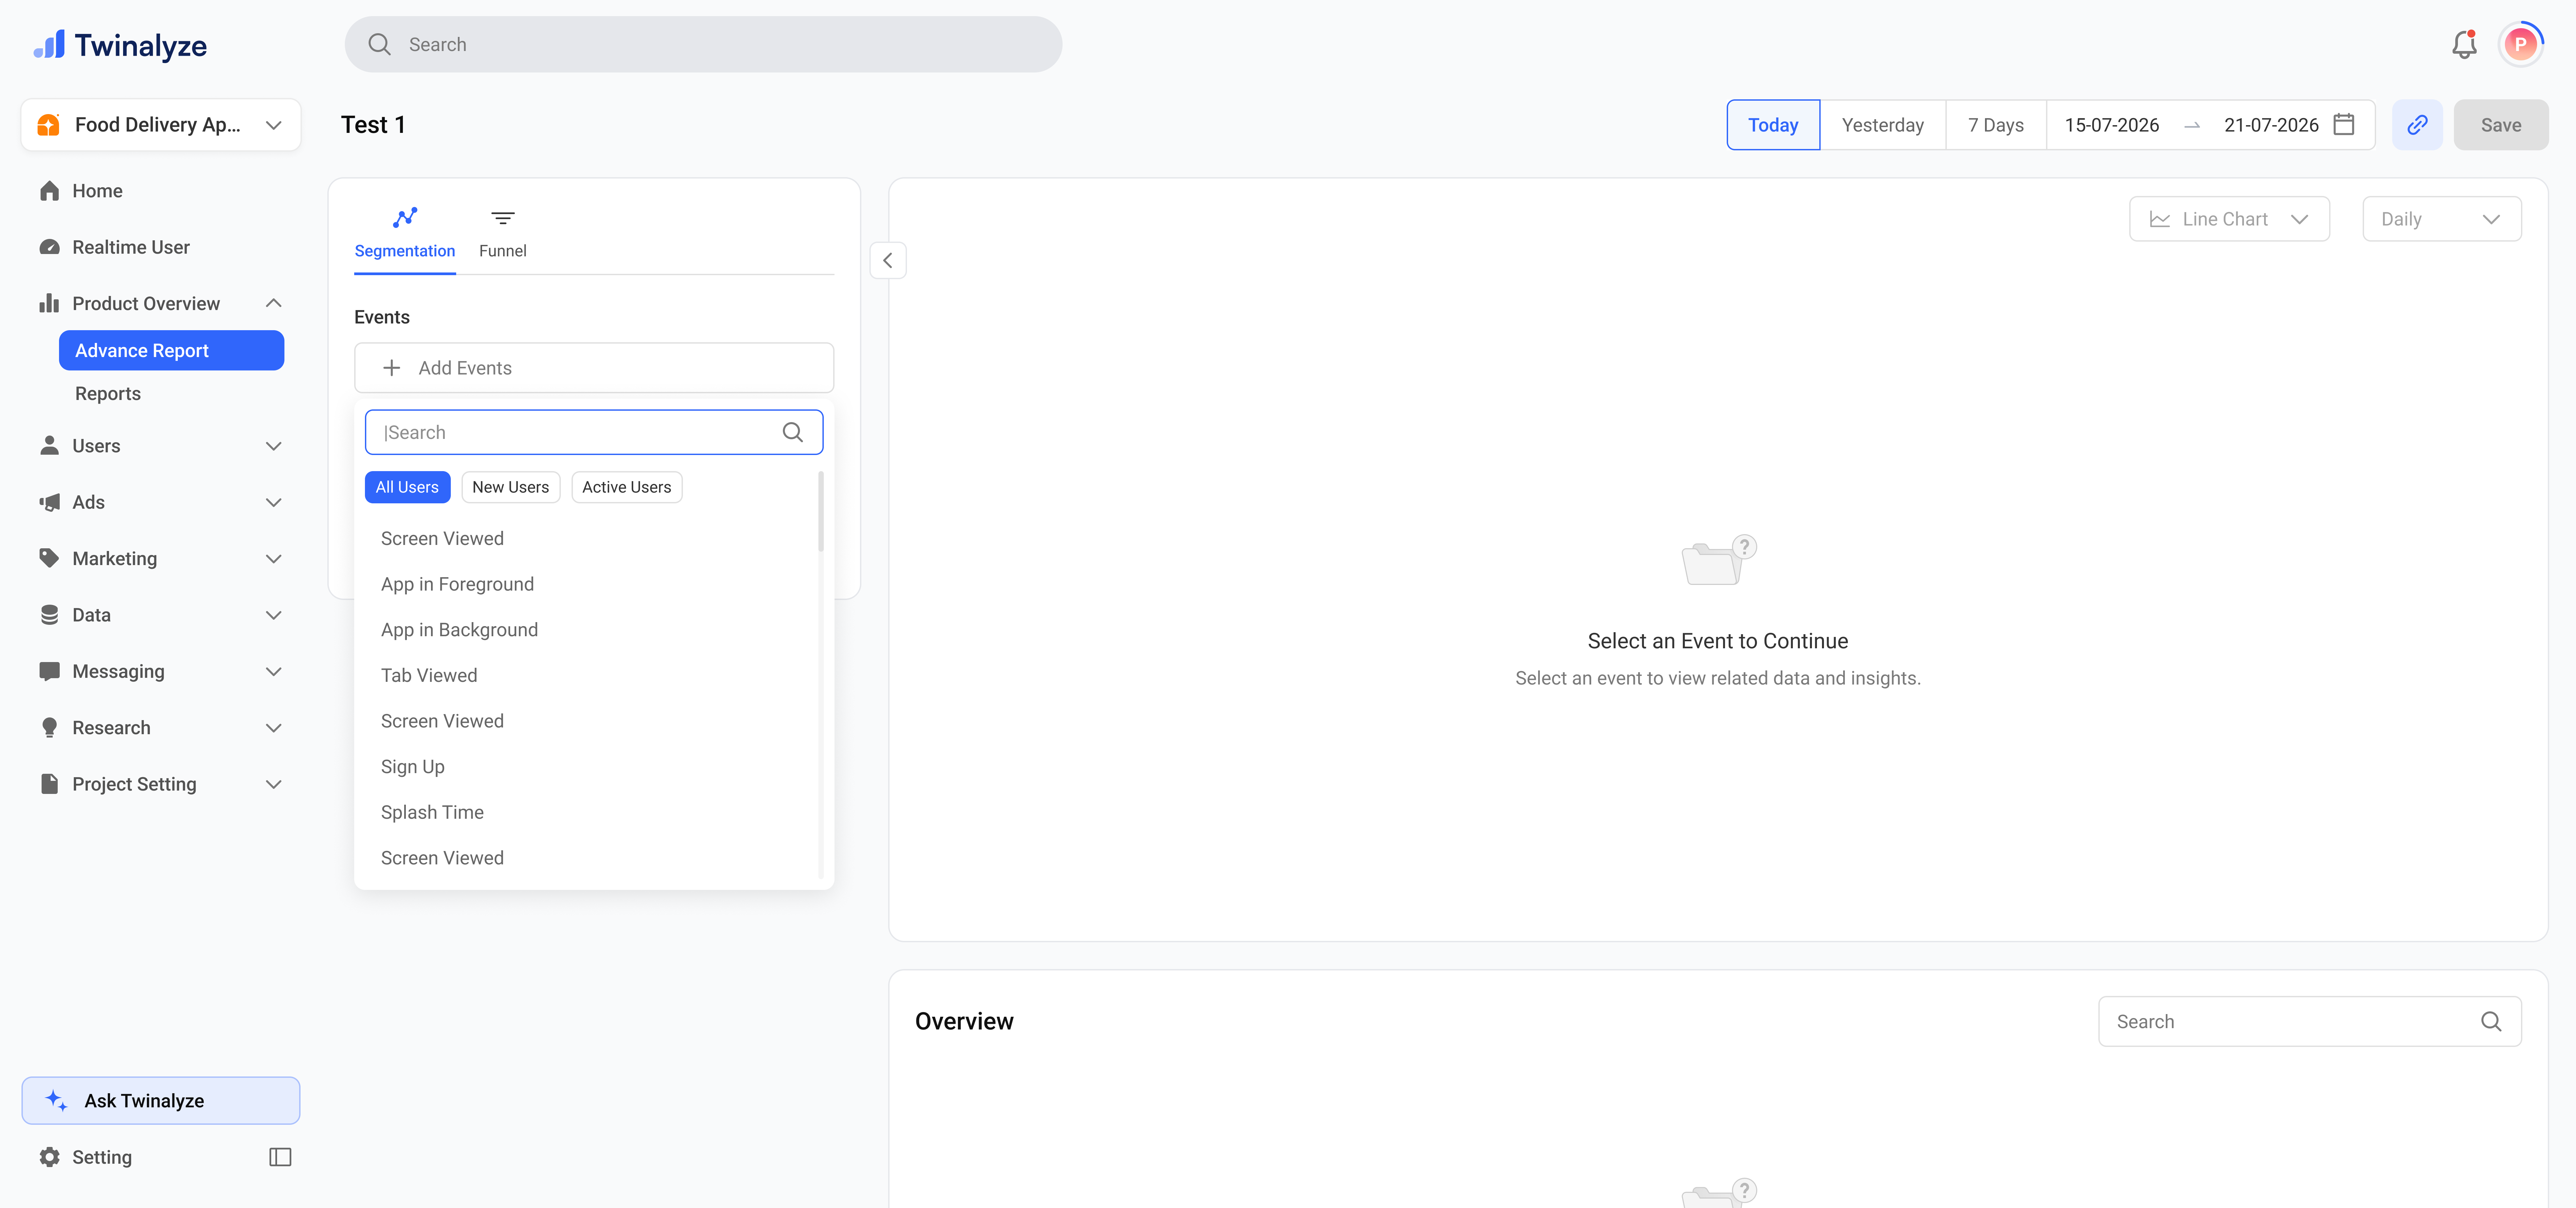 Use **Filter by** to narrow the report to a specific audience or condition.
Use **Group by** to split the event into meaningful segments such as country, city, Android OS, brand, or other properties.
Use **Filter by** to narrow the report to a specific audience or condition.
Use **Group by** to split the event into meaningful segments such as country, city, Android OS, brand, or other properties.
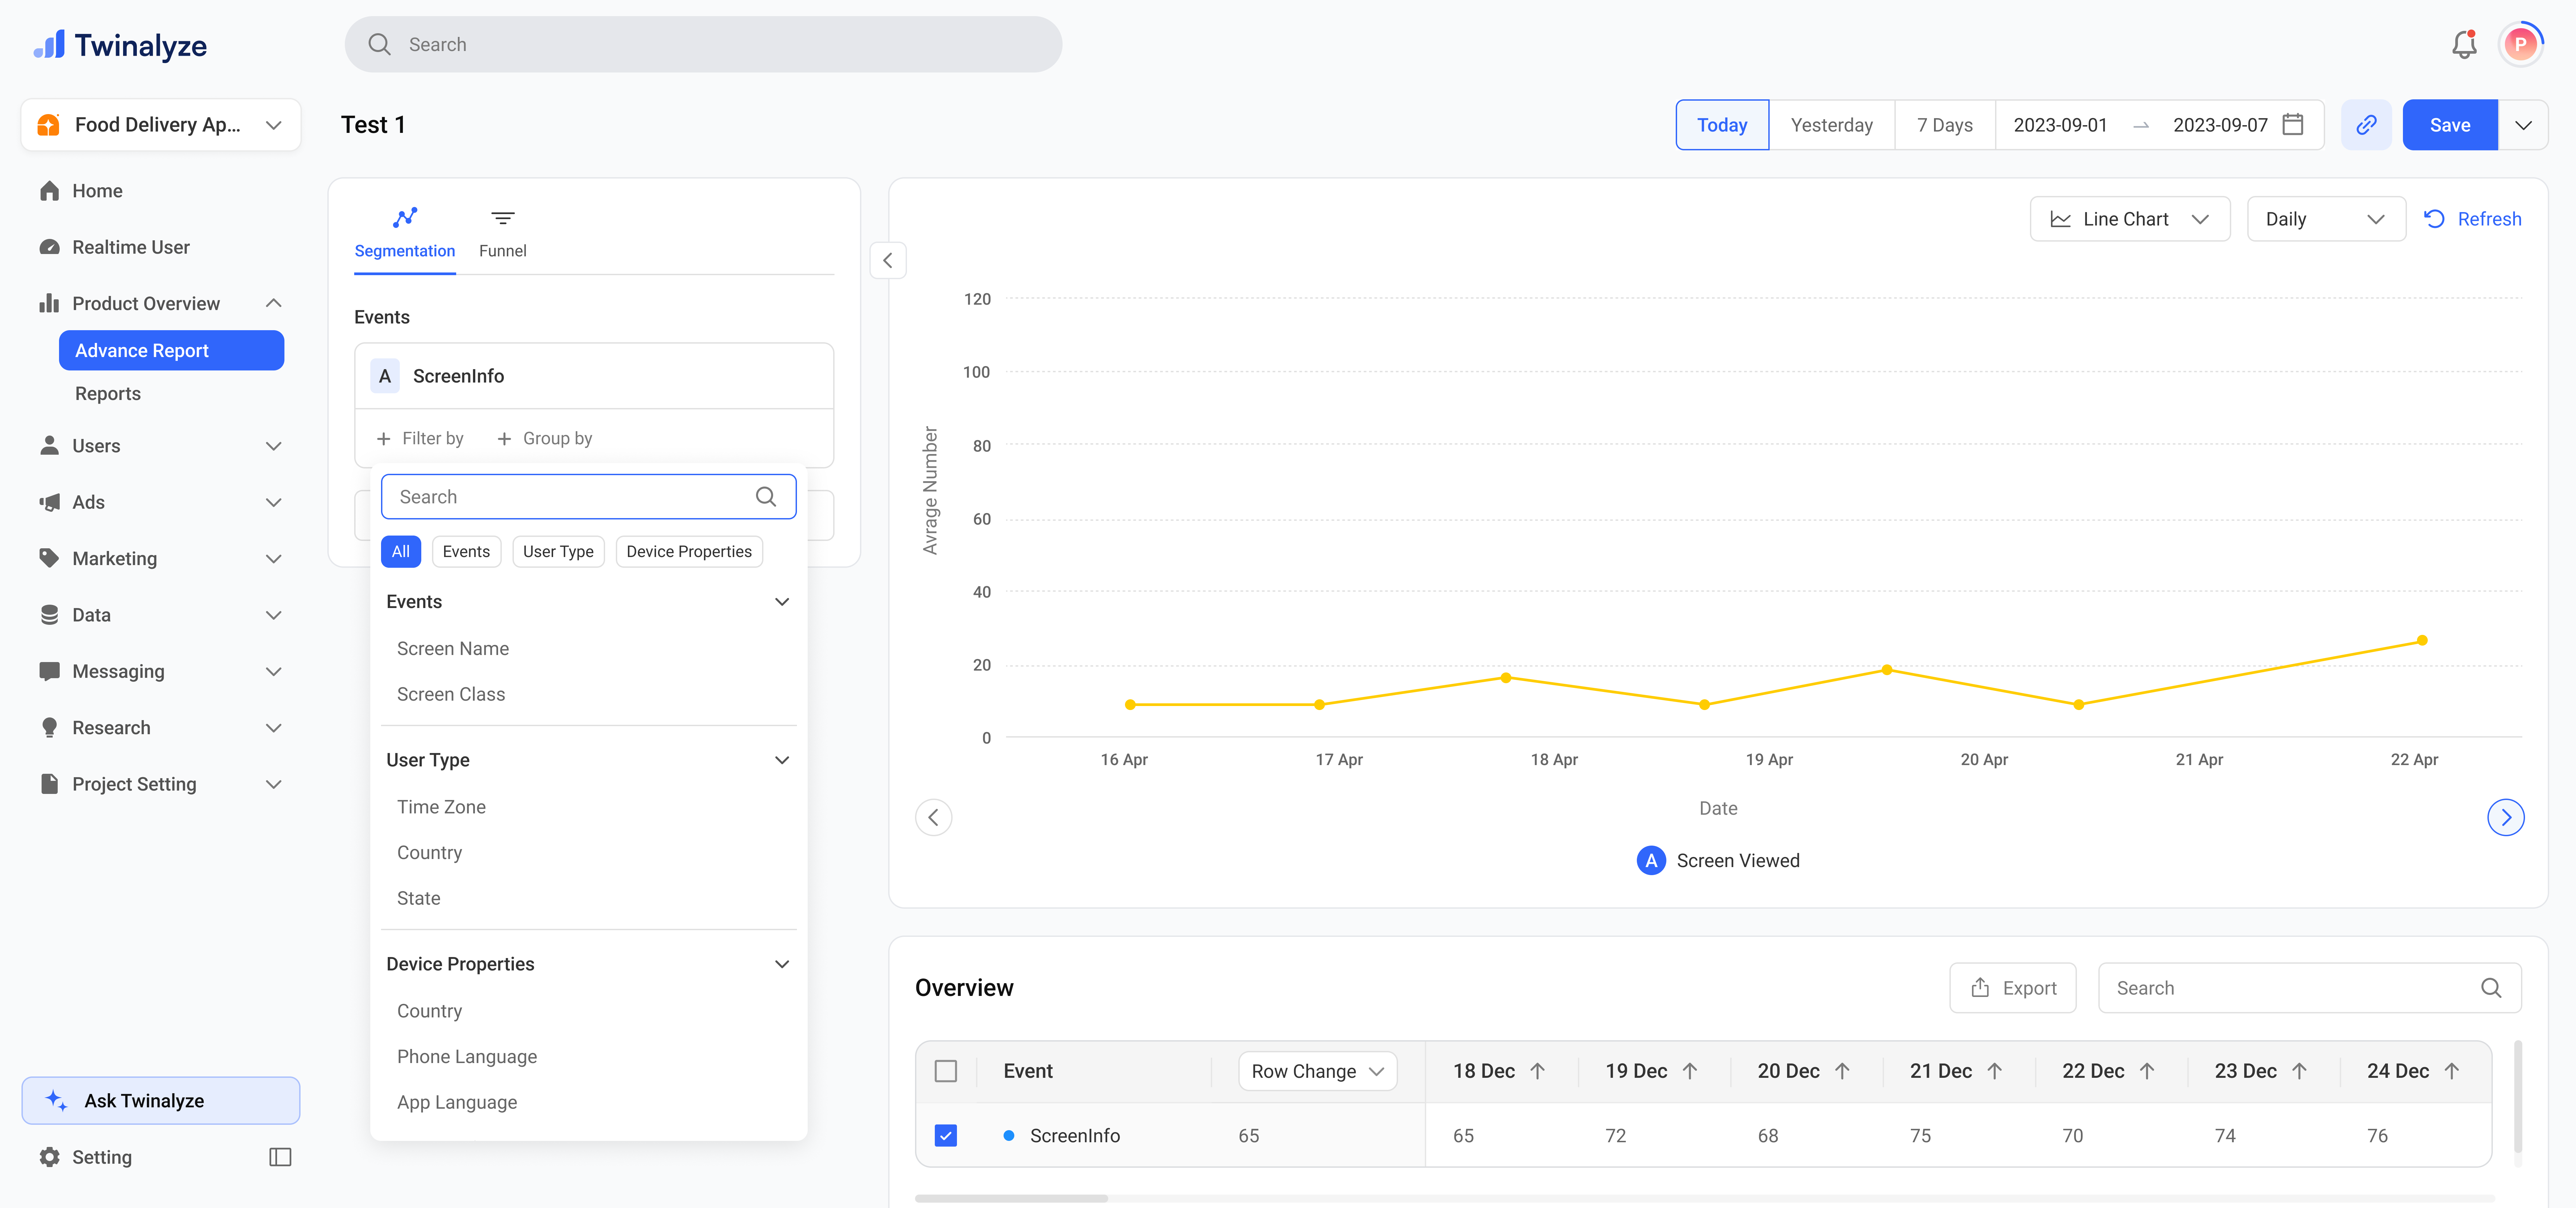 You can switch the chart type based on how you want to view the data:
* **Line Chart** for trends over time
* **Bar Chart** for event comparison
* **Stacked Bar** for grouped comparison
* **Pie Chart** for distribution view
You can switch the chart type based on how you want to view the data:
* **Line Chart** for trends over time
* **Bar Chart** for event comparison
* **Stacked Bar** for grouped comparison
* **Pie Chart** for distribution view
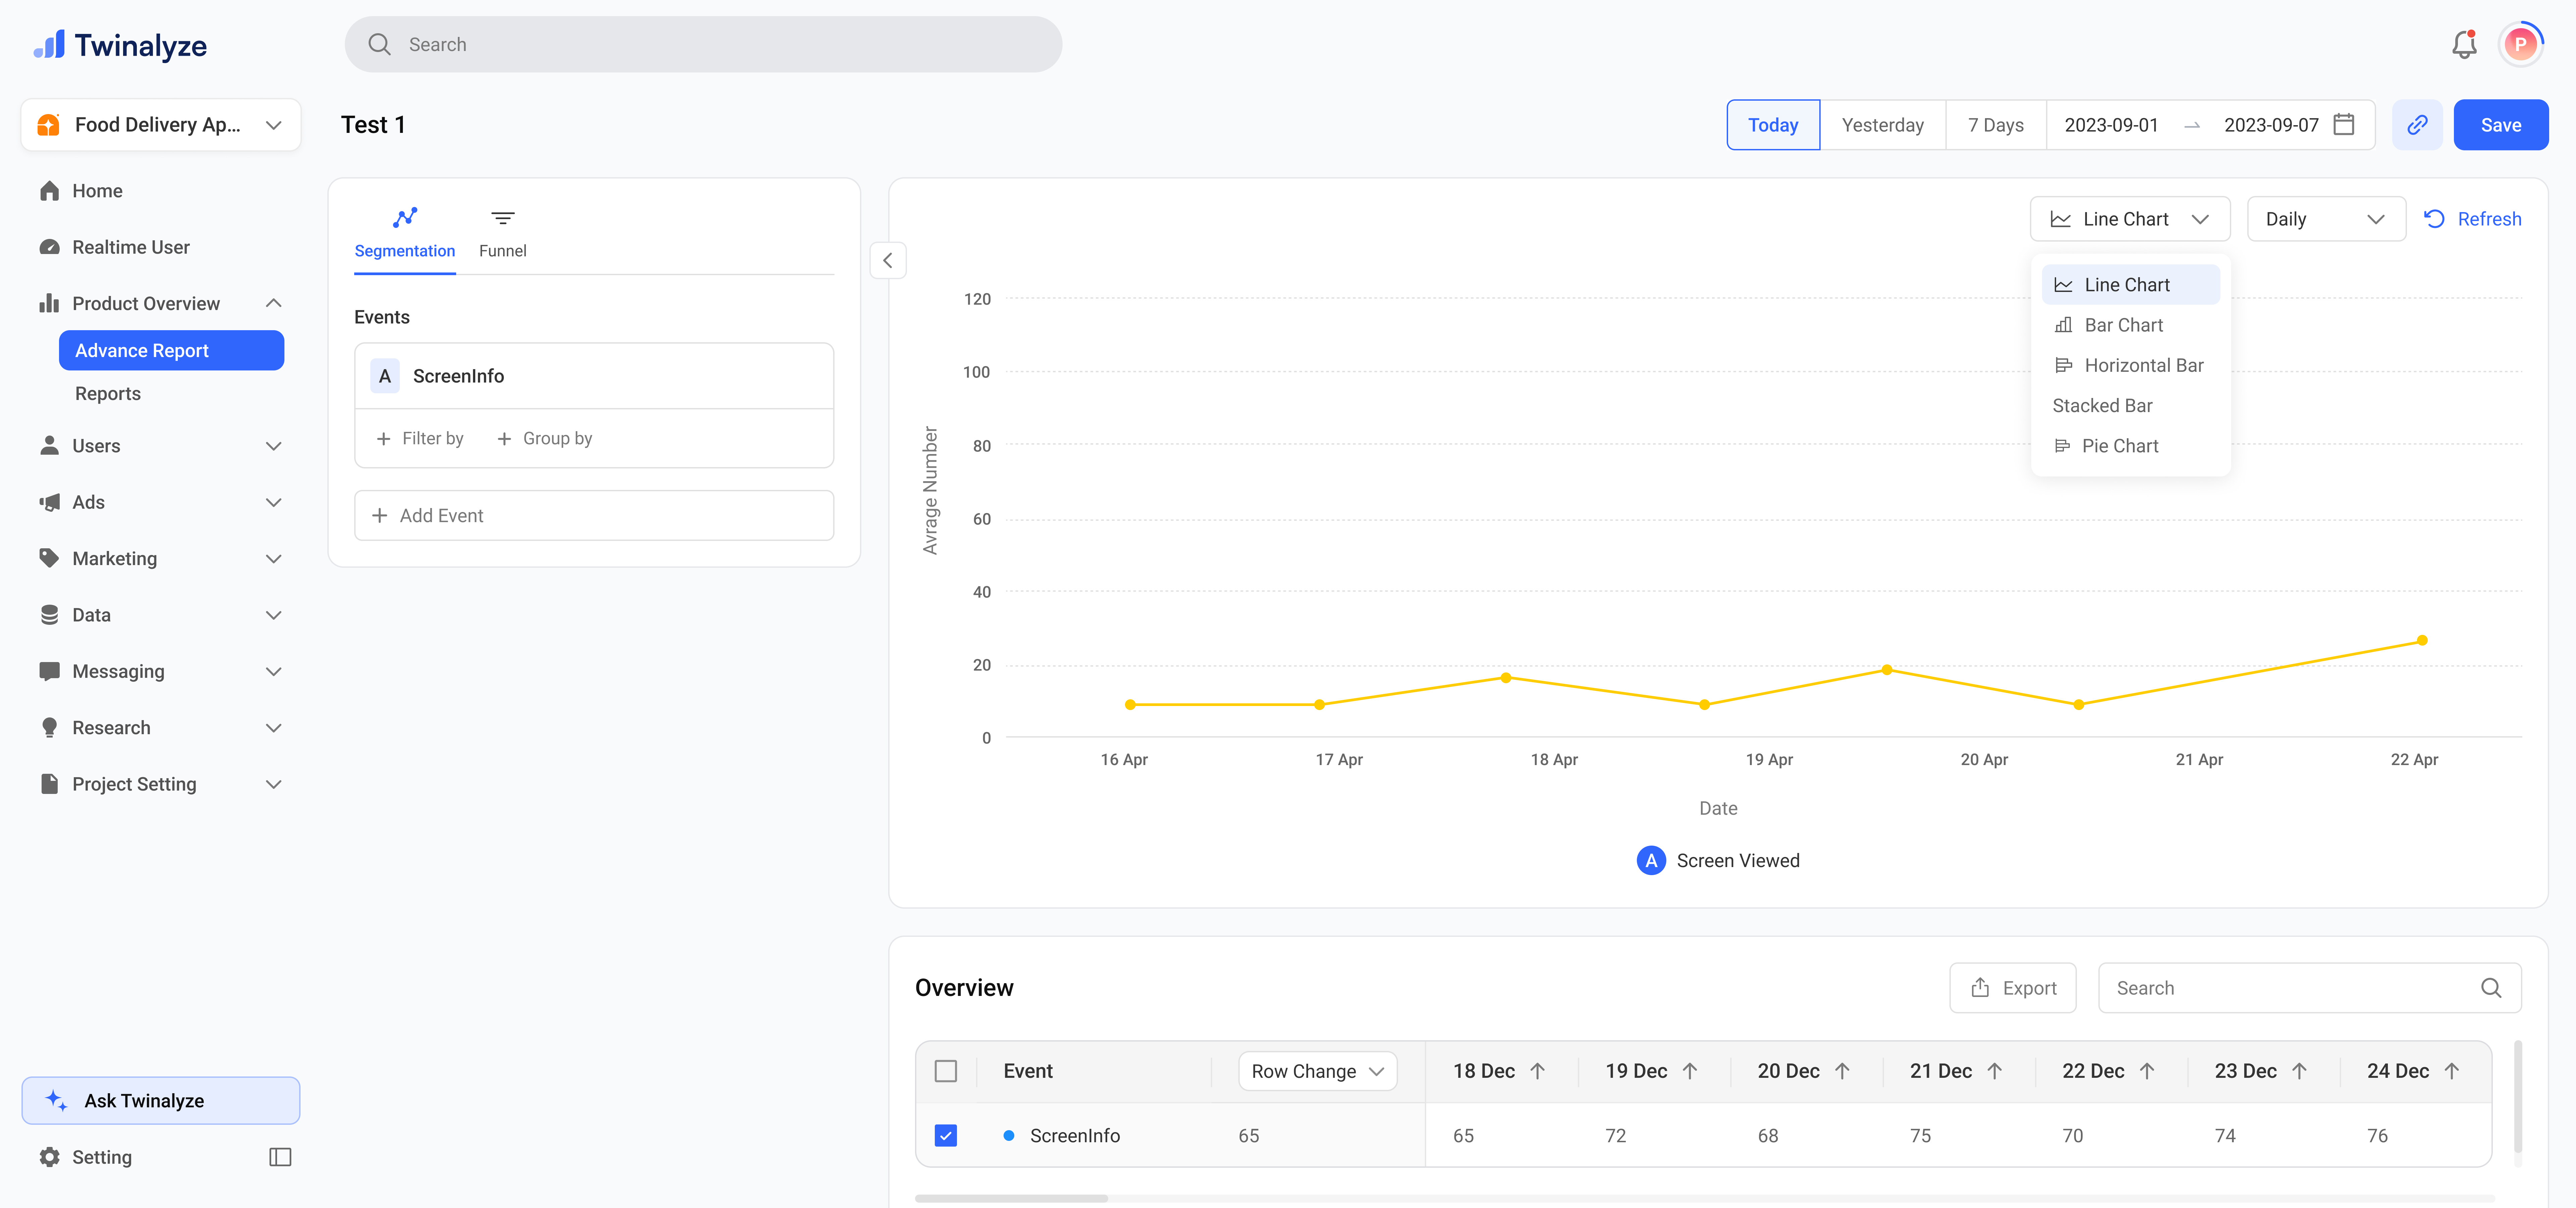 After setting up your event selection, filters, chart type, and date range, click **Save**.
Saving helps you keep the same report configuration so you or your team can open it from **Product Overview > reports**.
After setting up your event selection, filters, chart type, and date range, click **Save**.
Saving helps you keep the same report configuration so you or your team can open it from **Product Overview > reports**.
 ### Funnel
Funnel helps you measure how users move from one event step to the next.
It is useful when you want to understand user conversion and identify where users drop off.
Funnel starts with step-based analysis. Instead of comparing event trends, it measures how many users completed each next step.
### Funnel
Funnel helps you measure how users move from one event step to the next.
It is useful when you want to understand user conversion and identify where users drop off.
Funnel starts with step-based analysis. Instead of comparing event trends, it measures how many users completed each next step.
 Select the first event in the funnel.The first event becomes the starting point of the conversion flow and is treated as **100%** of users entering the funnel.
 Add the next events in the sequence to measure how users move forward.
For example, you may start with **Fragment Viewed** and then add **Back Screen** as the second step.
The chart and Funnel Table will then show how many users moved from the first step to the next one.
Add the next events in the sequence to measure how users move forward.
For example, you may start with **Fragment Viewed** and then add **Back Screen** as the second step.
The chart and Funnel Table will then show how many users moved from the first step to the next one.
 Use **Filter by** to narrow the funnel to a specific audience.
Use **Group by** if you want to compare funnel conversion across segments such as country, state, city, Android OS, or brand.
Use **Filter by** to narrow the funnel to a specific audience.
Use **Group by** if you want to compare funnel conversion across segments such as country, state, city, Android OS, or brand.
 Once your funnel steps, filters, and date range are set, click **Save**.
Saving helps you keep the same report configuration so you or your team can open it from **Product Overview > reports**..
Once your funnel steps, filters, and date range are set, click **Save**.
Saving helps you keep the same report configuration so you or your team can open it from **Product Overview > reports**..
